Introduction to Electrophysiology
Welcome to Dr Synapse! Today, we are going to synapse electrophysiology !
We start with the basics :
Catheter placement
The Computer system
Signal processing
Signal Sequence in Sinus Rhythm
Basic Conduction Intervals
Tissue Conduction
Supraventricular tachycardia diagnostic study
1 - Catheter placement
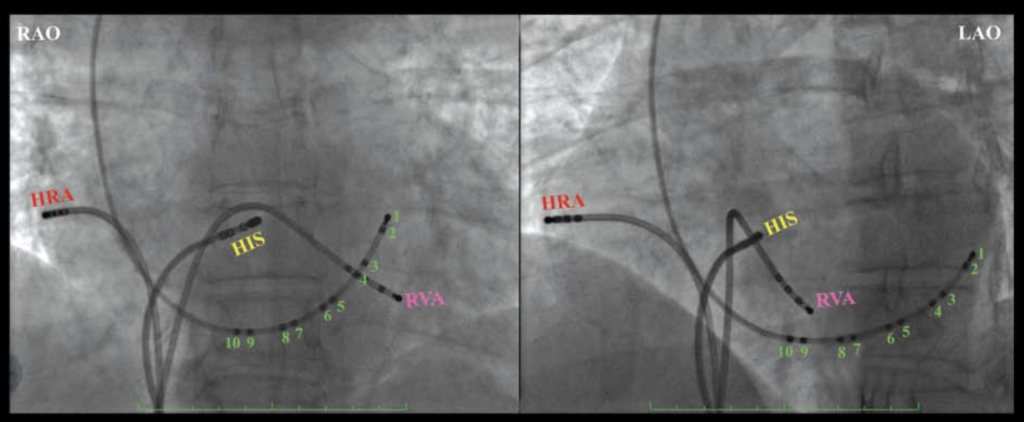
- High right atrial (HRA) : Positioned in the right atrial, it will record 1 atrial (A) signal.
- HIS : Postioned in the Atrioventricular (AV) node region, it will record 3 signals : A, Ventricular (V) & His (H) signals.
- Right ventricular apex (RVA) : Positioned in the Right ventricular apex, it will record 1 RV signal.
- Coronary Sinus (CS): Positioned in the vein situated between the left A and the left V, it will record 2 signals from the left A and left V.
Purves, P. D., et al. (2020). Cardiac Electrophysiology: Guide for Nurses, Techs, and Fellows. Cariotext.
2 - The computer system

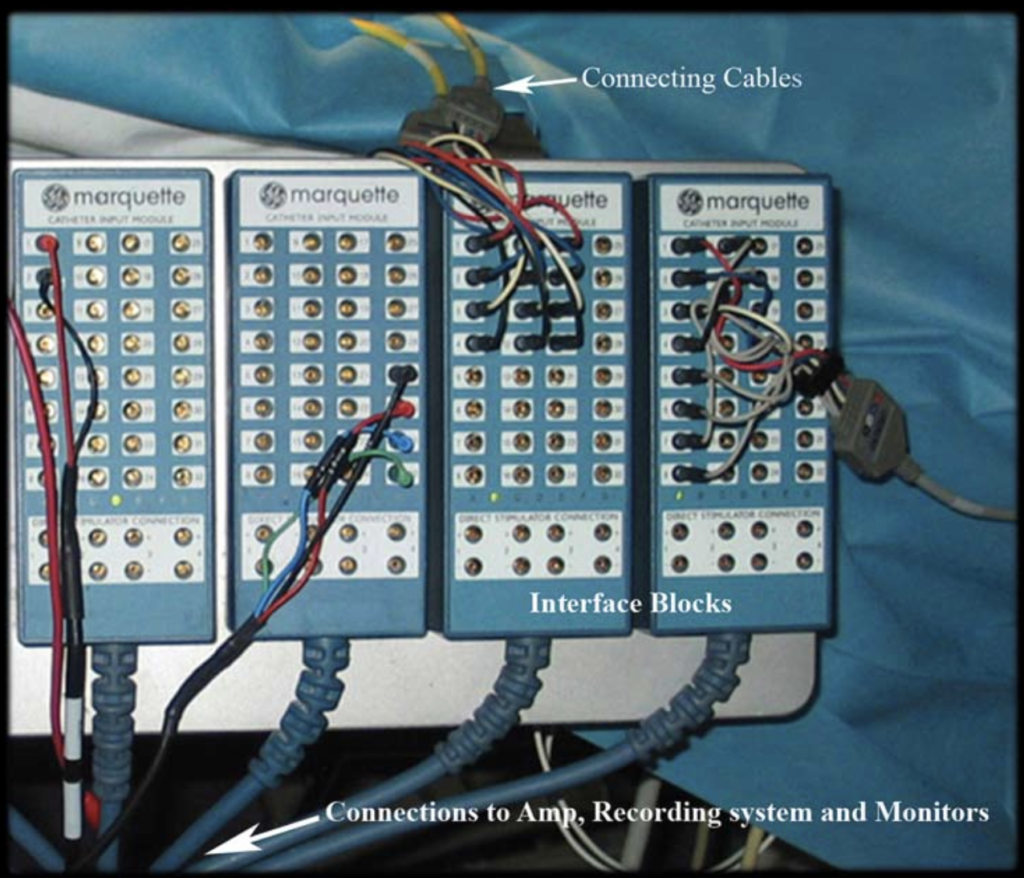
The electric signal take this path :
1- Intracardiac catheters : in the warm heart of your patient
2- Cables : next to you and must remain sterile
3- Blocks : are signal hubs, linking catheters to amplifiers
4- Amplifier : it is signal’s cheerleader, making it louder and stronger!
5- Recording system : is like a DJ, mixing and showcasing your catheter signals on the screen for the ultimate rhythm analysis!
6- Monitors : are like the heart’s gossip columns, spilling all the juicy details of its electric activity.
!!! Troubleshooting in EP is like untangling a spaghetti mess of connections—check that catheters are snug, cables are plugged into the right boxes, and boxes are talking to the amplifier. Also, don’t forget to check gains, filters, and that nobody accidentally hit the “off” switch. Oh, and plugging catheters into the wrong pins? Classic rookie move !!!
Purves, P. D., et al. (2020). Cardiac Electrophysiology: Guide for Nurses, Techs, and Fellows. Cariotext.
3 - Signal processing

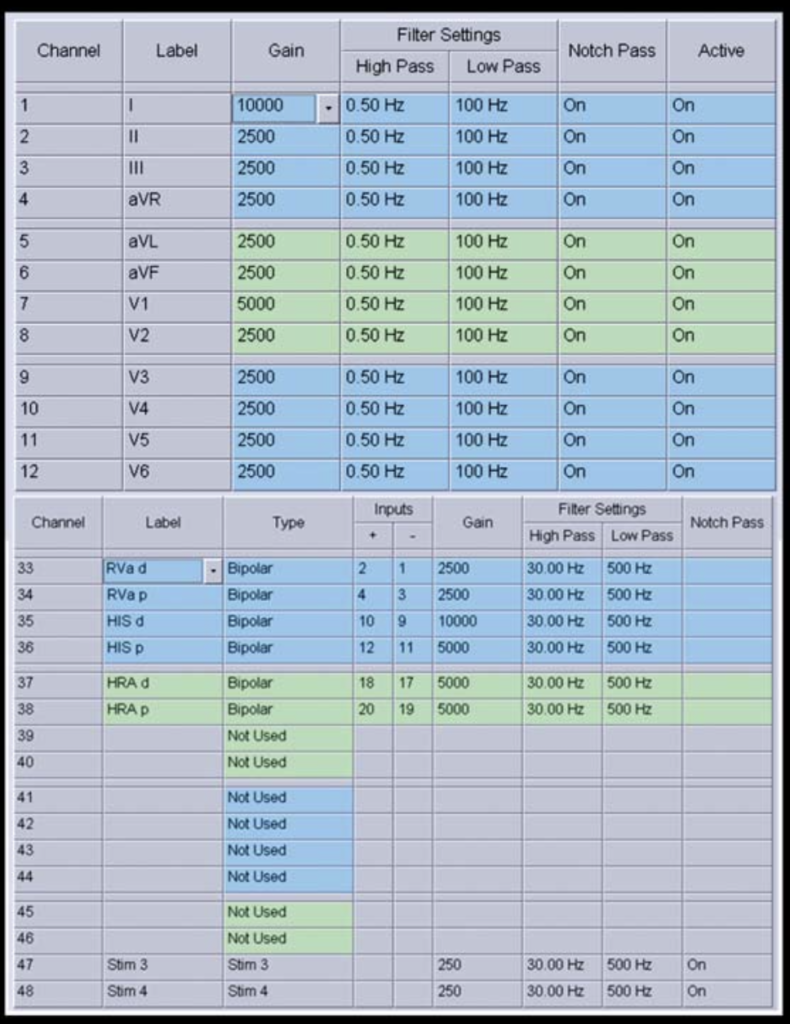
Seeing signals on the monitor is like tuning a radio to hear just the right music—except here, we’re fine-tuning the heart’s electric symphony. Here’s the breakdown:
- Gain: Think of it as a volume knob—it makes the signals bigger, but also amplifies any unwanted noise (so it’s like turning up static on the radio too).
- Clipping: Keeps signals neatly on the screen, preventing them from bumping into their neighbors like polite party guests.
- High-pass filter: It’s like letting only the high-energy partygoers (high frequencies) into the room, blocking the slow dancers (low frequencies).
- Low-pass filter: The reverse bouncer—it welcomes the chill vibes (low frequencies) and keeps the wild high-frequency guests outside.
Together, these filters create a “Goldilocks zone” of signals, showing only the ones between 30 and 500 Hz—just right for intracardiac signals. The notch pass filter? It’s the hero that zaps annoying 60-Hz noise, like a buzzing fly in the room.
Bonus tip: Play with the filters and watch the ECG change! A cleaner signal looks nice, but don’t scrub away too much—important details might vanish. It’s all about finding that sweet spot between clarity and completeness!
Purves, P. D., et al. (2020). Cardiac Electrophysiology: Guide for Nurses, Techs, and Fellows. Cariotext.
4 - Signal Sequence in Sinus Rhythm

Here’s a simplified and amusing version:
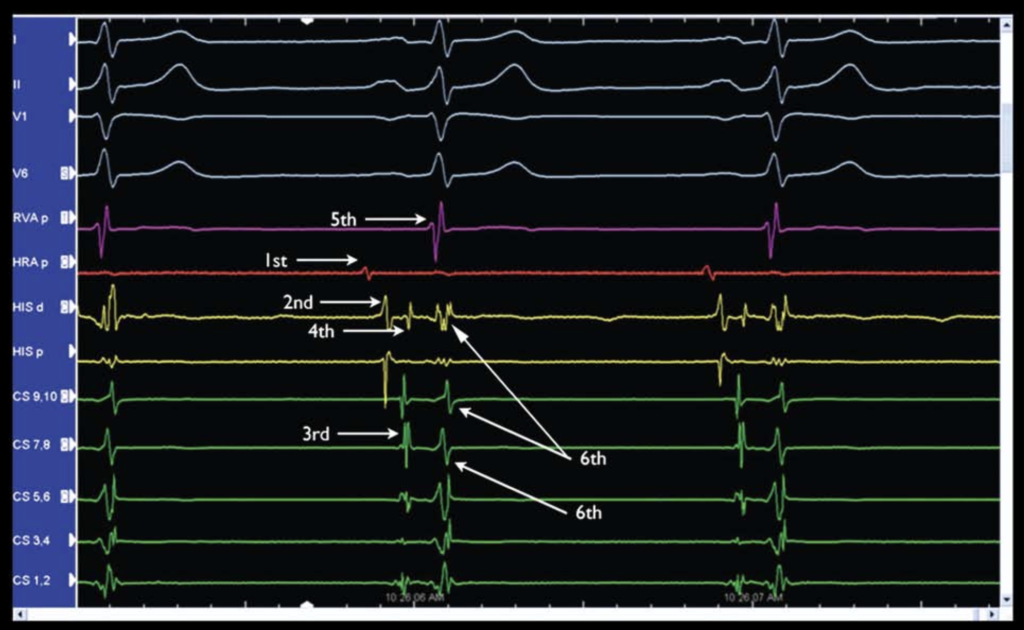
- HRA A: The early bird! This signal shows up first because the HRA catheter is closest to the SA node. It kicks off the P-wave party.
- HIS A: Next in line, the atrial depolarization wave hits the AV node, and HIS A says, “I’m here!”
- CS A: The wave spreads through the coronary sinus (CS) like a relay race, passing into the left atrium.
- HIS H: The wave takes the AV highway to the bundle of His—time for the big “H” deflection!
- RVA V: Boom! The right ventricle gets in on the action first because it’s near the bundle branch exit. It beats the HIS V and CS V to the finish line.
- HIS V & CS V: These are the stragglers, showing up last since they’re hanging out at the base of the ventricles.
Pro Tip: In normal sinus rhythm, the RVA V signal leads the way. But with a right bundle branch block (RBBB), the left ventricle takes over as the early bird. Watch for changes—they might reveal a sneaky accessory pathway (AP)!
It’s like a heart’s electrical dance routine—every step in order, unless there’s a twist in the choreography!
Purves, P. D., et al. (2020). Cardiac Electrophysiology: Guide for Nurses, Techs, and Fellows. Cariotext.
5 - Basic conduction intervals

Think of an EP study like timing a relay race for your heart’s electricity! Here’s the play-by-play:
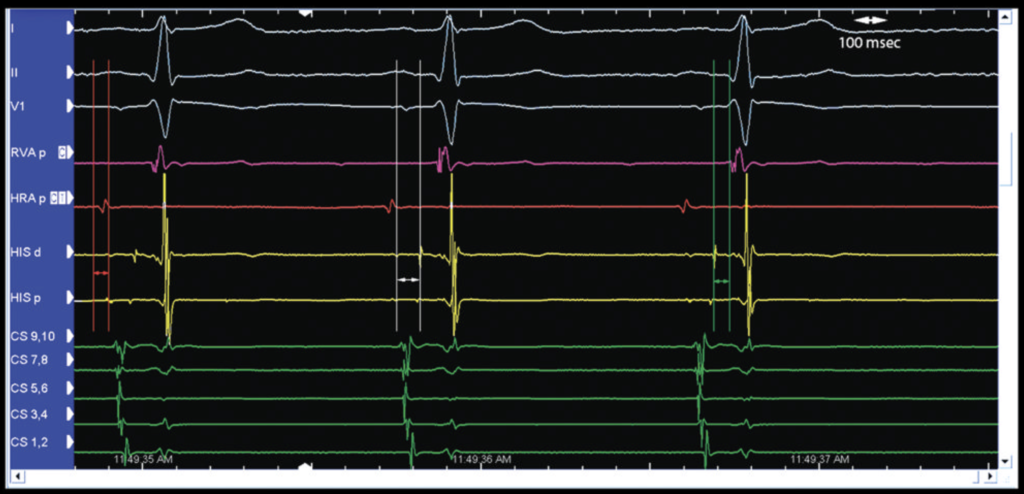
P-A Interval: The sprinter from the SA node to the AV node.
- How to measure: Use the surface ECG to find the start of the P-wave, then jump to the HIS channel and measure to the rapid deflection of the A-wave. (red calipers)
- Normal time: 35–45 msec. This is the trans-right atrial “sprint time.”
A-H Interval: The baton pass through the AV node!
- How to measure: Stay on the HIS channel. Start at the A-wave, and measure to the beginning of the H deflection. (white calipers)
- Normal time: 70–80 msec. This is your trans-nodal “handoff time.”
H-V Interval: The final dash to the ventricles!
- How to measure: Start at the H-wave on the HIS channel and measure to the earliest ventricular activation—usually the start of the QRS complex on either an intracardiac or surface ECG. (green calipers)
- Normal time: 35–45 msec. This is the His-to-ventricles activation time.
Add them all up for the PR Interval:
PR = P-A + A-H + H-V = ~160 msec.
Why it’s important:
- Know your baseline A-H—it’s key for spotting AV node delays (“jumps”).
- A long H-V? That’s like the final runner pulling a hamstring—watch out for His-Purkinje disease.
In short, grab your calipers and stopwatch, and time your heart’s electric relay race! 🏁
Purves, P. D., et al. (2020). Cardiac Electrophysiology: Guide for Nurses, Techs, and Fellows. Cariotext.
6 - Tissue conduction

Tissue Conduction: Heart Traffic Rules 🚦
Think of tissue conduction like managing traffic flow on your heart’s highways:
Conduction Velocity = Speed Limit 🏎️
- This is how fast electrical signals (cars) travel between cells. Some roads (tissues) are faster than others, but speed isn’t everything!
Refractory Period = Red Light 🛑
- After a signal passes, the tissue needs time to recover (a red light) before it’s ready for the next one. The Effective Refractory Period (ERP) is the point where the road says, “No more cars for now!”
ERP Example (AV Node) 🚧
- Imagine cars (signals) arriving at a tollbooth (AV node). You gradually send them closer together (extra-stimuli, S2) until the tollbooth closes. That’s your ERP—it tells you when the AV node needs a break.
Block Cycle Length = Traffic Jam Limit 🚗🚕🚙
- How fast can you send cars through before traffic jams and nothing gets through? This is the Wenckebach cycle length—a short length means the road can handle speedy cars during a tachycardia.
Extra-Stimulus Technique = Traffic Scanner 🛠️
- Start with a steady flow of cars (S1 pacing). Then sneak in an early car (S2) to see how the road handles it.
- Fast Pathway Clear: Cars zoom through the main highway.
- Blocked Fast Pathway: Cars detour onto the slower scenic route.
- Blocked Slow Pathway: No one gets through—total gridlock!
- Start with a steady flow of cars (S1 pacing). Then sneak in an early car (S2) to see how the road handles it.
In short:
- Fast roads (tissues) can have long red lights (refractory periods).
- Slow roads might handle a faster flow of cars.
- The goal? Map the traffic patterns to keep your heart running smoothly! 🛣️💓
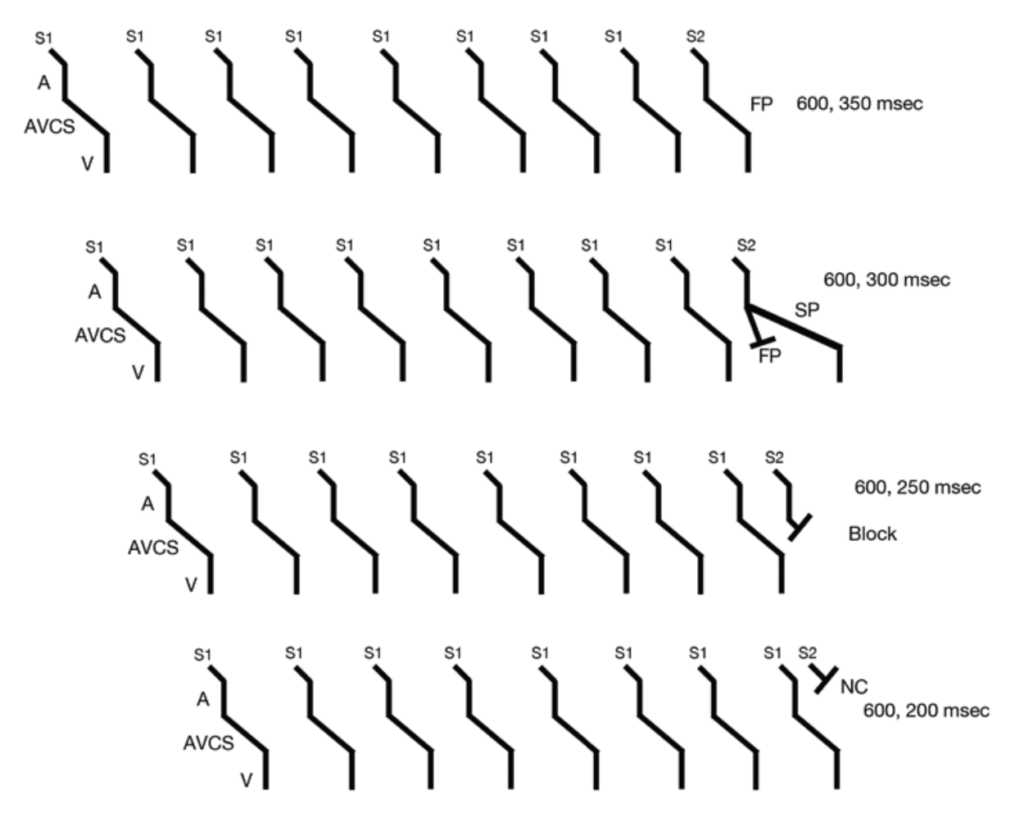
This image shows how the extra-stimulus technique works, like testing how early a signal can arrive before the heart says, “Nope, too soon!”
How it works:
- The heart is paced steadily for 8 beats (S1).
- Then, an extra beat (S2) is added earlier and earlier after the last S1 to test how the heart responds.
What happens:
- At first, S2 goes through the fast AV nodal pathway (top row).
- If S2 is earlier, the fast pathway blocks, and the signal detours through the slow pathway (second row).
- If S2 gets even earlier, both fast and slow pathways block (third row).
- Eventually, S2 is too early to even capture the atrium (fourth row).
What it tells us:
By finding the point where S2 no longer conducts, you can measure the Effective Refractory Period (ERP)—the longest interval that doesn’t make it to the next level of conduction.
Purves, P. D., et al. (2020). Cardiac Electrophysiology: Guide for Nurses, Techs, and Fellows. Cariotext.
7 - Supraventricular tachycardia diagnostic study (SVTDS)
Let’s dive into how EP figure out what’s going on during SVT in a way that’s easy to understand. Imagine this like tuning a musical instrument to figure out how it plays certain notes. Instead of notes, we’re testing how signals travel in your heart!
Starting from the Bottom and Sparking to the Top!
First up, we’re starting at the bottom—stimulating the ventricle. Picture the electricity as a runner sprinting backward, heading toward the back of the heart. 🏃♂️💨
Next, it’s time to flip the game! We’ll stimulate the atrium, sending that electrical energy racing forward like a sprinter going for gold. 🏃♀️✨
It’s like a heart-powered relay race, with electricity passing the baton from back to front! 🏅
- Incremental Ventricular Pacing (V)
- Retrograde Wenckebach (V)
- Ventricular Extra-stimulus Pacing (V)
- Retrograde V-A block (V)
- Ventricular Effective Refractory Period (V)
- Atrial Extra-stimulus Pacing (A)
- Atrioventricular Block (A)
- Atrial Effective Refractory Period (A)
- Incremental Atrial Pacing (A)
7.1. SVTDS - Incremental Ventricular Pacing (V)
The Basics of Pacing 
- We start by pacing the heart faster than its natural rhythm—think of speeding up the tempo of a song.
- Every few beats, we slightly increase the speed until the heart stops keeping up with the “dance moves” between its ventricles and atria. This tells us the “Wenckebach cycle length”—basically, the point where the heart says, “Nope, I can’t follow this beat anymore.”
- But we don’t overdo it (over than 250 ms). Why? Because pushing the tempo too fast could lead to dangerous rhythms like ventricular tachycardia (VT) or ventricular fibrillation (VF)—not what we’re aiming for here!
Four Key Questions to Answer 
Did the pacing work?
- Look at the heart’s “recording” (ECG and internal signals) to confirm that our electrical signals are controlling the ventricles.
Is the message getting through (V-A conduction) ?
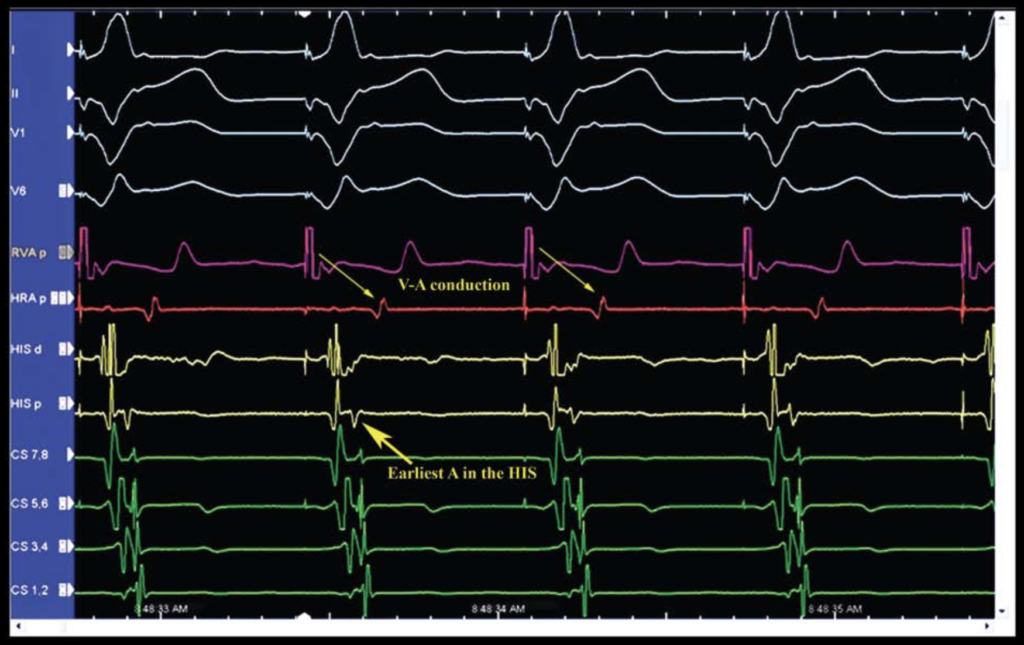
- Check if the signal from the ventricule (RVA channel) reaches the atria (HRA channel). Is it a steady back-and-forth (1:1), or is the atria doing its own thing? Think of it like checking if the drummer and guitarist are in sync during a jam session.
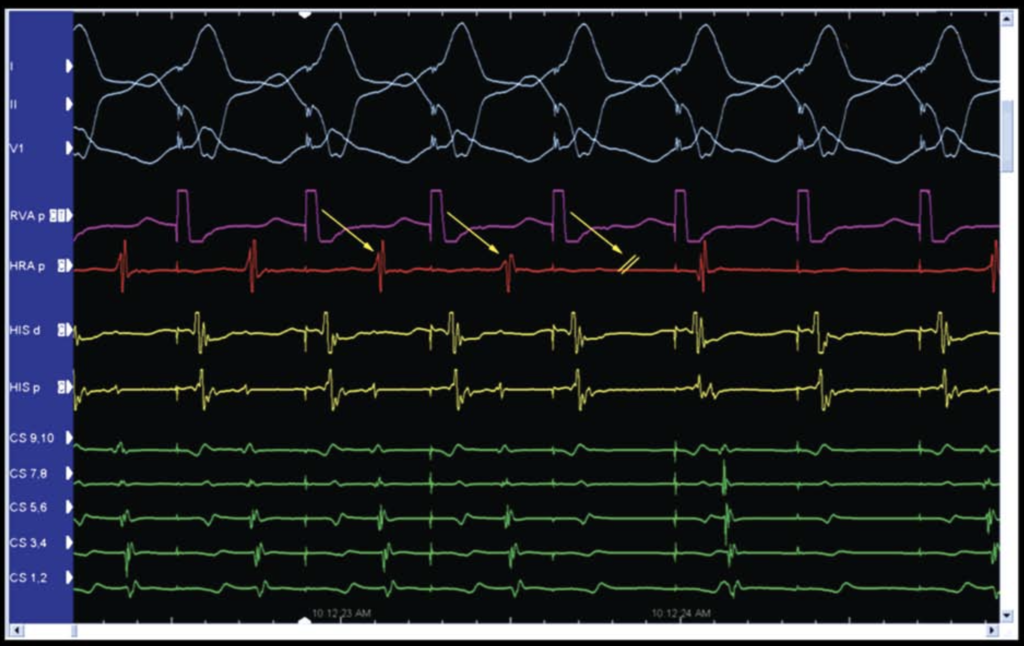
This example shows each VEGM followed by an AEGM, or 1:1 conduction (arrows).
- Check if the signal from the ventricule (RVA channel) reaches the atria (HRA channel). Is it a steady back-and-forth (1:1), or is the atria doing its own thing? Think of it like checking if the drummer and guitarist are in sync during a jam session.
Where’s the signal starting?
- Normally, the signal goes back to the atria through the AV node, lighting up the HIS A area first (like the first note in a melody), then proximal CS to the distal CS. This is called “central” or “concentric” activation—everything is in the expected order.
- If something else lights up first, it’s “eccentric activation”—imagine a rogue band member jumping in with their own beat. This could mean there’s an extra pathway (called an accessory pathway or AP) bypassing the usual route.
Does the timing stay steady or slow down?
- As the pacing gets faster, signals passing through the AV node normally slow down a bit (it’s like the AV node saying, “Wait, let me catch up!”). If this doesn’t happen, it might mean the signal is skipping the AV node altogether and using an AP.
Bonus Question: What’s the V-A Time?
- V-A time is how long it takes for the signal to travel from the ventricles back to the atria. If it’s longer than usual, it could mean the heart is using a slower or unusual pathway. Figuring out exactly what’s going on here might need more pacing tricks! (Slow pathway or a decremental AP)
Purves, P. D., et al. (2020). Cardiac Electrophysiology: Guide for Nurses, Techs, and Fellows. Cariotext.
7.2. SVTDS - Retrograde Wenckebach (V)
Retrograde Wenckebach – The Heart’s Version of “Missed Calls” 📞❤️
Let’s simplify this: we’re testing how the heart sends signals backwards, from the ventricles (V) to the atria (A). Think of it like trying to call a friend, but the phone line gets busier as you dial faster. At some point, the call just won’t go through anymore. That’s what we call the Retrograde Wenckebach Point—the heart’s “busy signal.
What’s Happening in the Heart?
At first, every ventricular signal (V) has a matching atrial signal (A)—like a perfect game of ping-pong. 🎾
- On the heart’s “channels” (RVA in magenta and HRA in red), you can see this neat back-and-forth for the first three beats.
But then—oops!—on the fourth beat, there’s a V signal (magenta) but no matching A signal (red). The atria didn’t “pick up the call.” 📵 This means we’ve reached the Wenckebach point, where the heart can’t keep up with the faster pacing rate anymore.
On other “channels” (yellow HIS and green CS), you’ll notice the time between the V signal and A signal gets longer as pacing speeds up. This shows the AV node (the heart’s switchboard) is getting slower—totally normal behavior, by the way.
Key Takeaways 📋
Wenckebach = Normal AV Node Behavior
The AV node takes longer and eventually gives up when signals come too fast. That’s just how it’s built! ⚙️Watch for Decrement (Slowdowns):
Measure how the time between V and A signals changes during pacing. If there’s no slowdown, we might be dealing with a shortcut in the heart’s wiring, like an accessory pathway (AP)—think Wolff-Parkinson-White (WPW) syndrome, where signals zip around too fast.
Purves, P. D., et al. (2020). Cardiac Electrophysiology: Guide for Nurses, Techs, and Fellows. Cariotext.
7.3. SVTDS - Ventricular Extra-stimulus Pacing (V)
Testing the Heart’s Limits, Simplified 💓
Imagine testing a friend’s patience by sending them messages closer and closer together. At some point, they won’t be able to respond in time. That’s essentially what we’re doing with the heart: stimulating it faster and faster to see how it handles the pressure and when it “misses a beat.”
How Does It Work? 🛠️
The Basics:
- Start with a steady series of 8 signals (S1) to warm up the heart and establish a baseline rhythm.
- Then, throw in a surprise signal (S2) sent a little earlier than expected to see how the heart reacts.
The S1-S2 Interval:
- The time between the last S1 and the S2 is called the S1-S2 interval.
- With each sequence, this interval is shortened, like asking your friend to reply to messages faster and faster. How long can they keep up?
Two Pacing Speeds:
- This test is done at two different pacing speeds:
- A “moderate” speed, starting with intervals of 600 milliseconds (msec).
- A “faster” speed, starting with intervals of 400 msec.
- This test is done at two different pacing speeds:
What Are We Looking For? 🔍
The V-A Time:
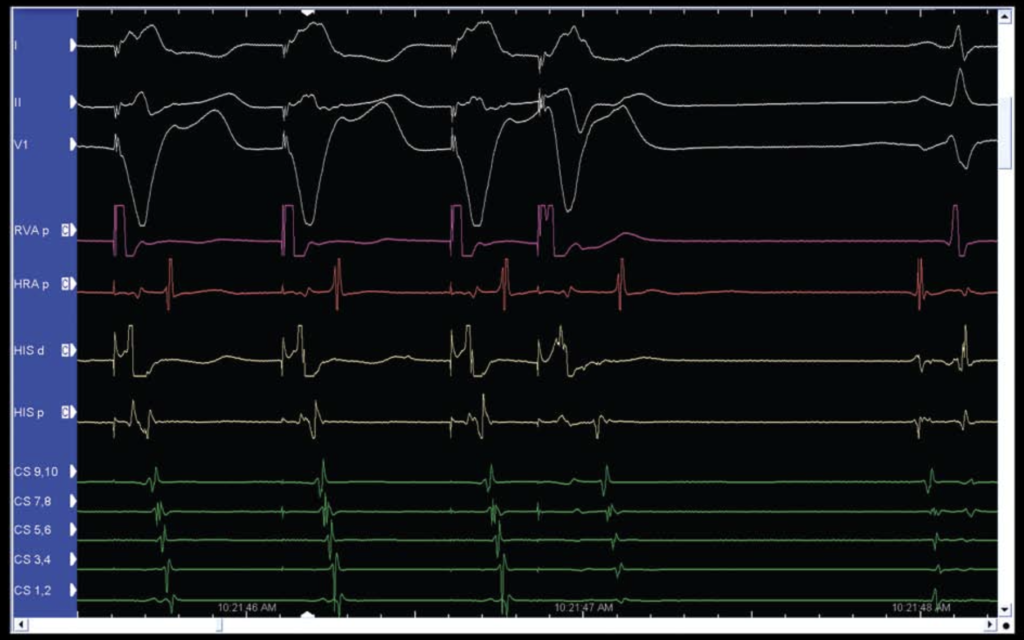
After the S2, we measure how long it takes for the signal to travel back from the ventricles (V) to the atria (A). As the S1-S2 interval gets shorter, the V-A time usually gets longer because the AV node slows down—this is called decrement, and it’s normal.The “Jump”:
If the V-A time suddenly increases by more than 50 msec, it’s called a jump. This indicates that the heart has switched the pathway the signal is using to return. Possible reasons include:- Switching from the fast pathway to the slow pathway in the AV node.
- A block in an accessory pathway (AP), forcing the signal to use the AV node.
- A block in the right bundle branch, making the signal detour through the left side.
A Test Full of Clues 🎯
This test is like a Q&A session with the heart. By pushing it to its limits, we reveal how it handles stress and uncovers how its electrical pathways behave. Each “jump” or sudden change provides valuable insights into the mechanisms behind tachycardias.
It’s like testing how a runner adapts their pace or route when faced with unexpected obstacles. 🏃♂️❤️
Purves, P. D., et al. (2020). Cardiac Electrophysiology: Guide for Nurses, Techs, and Fellows. Cariotext.
7.4. SVTDS - Retrograde V-A block (V)
A Smooth Ride
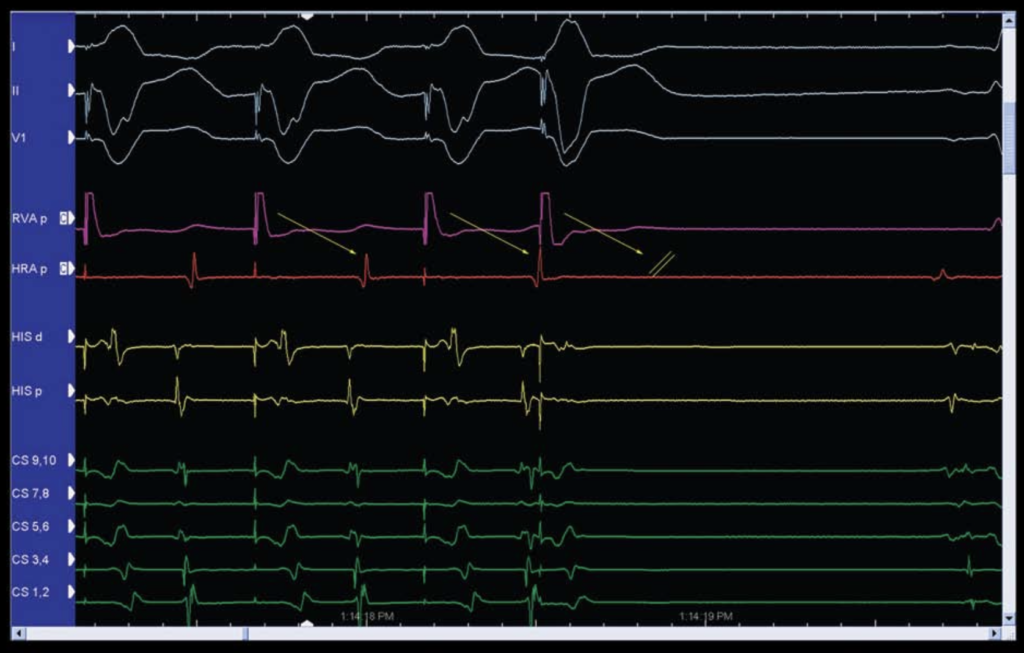
Think of the heart’s conduction system like a rollercoaster ride. Each signal (S1 and S2) is like a car on the track, and the atrium is the worker who resets the rollercoaster after each ride. If the cars come too close together, the worker doesn’t have enough time to reset everything, and the second car (S2) can’t get through. This is called V-A conduction block—the atrium just isn’t ready for the next ride yet!
In the tracing, notice the magenta S2 (third arrow). There’s no red A after it on the HRA channel—that’s like a rollercoaster car stuck at the station, unable to launch. You’ll also spot the absence of A signals on the other channels. The ride is officially closed for business!
Here’s a twist: Not everyone’s “rollercoaster” works the same way. Some people have two tracks on the AV node—one super-fast and one slower. If the system suddenly switches from the fast track to the slow one, you’ll see a big jump in the V-A time. It’s like switching from a high-speed rollercoaster to a kiddie train mid-ride. This jump might hint at a setup for a reentrant circuit.
Bonus Quirk: Sometimes, after reaching the point where the signal can’t get through, the AV node pulls a surprise move and starts working again at an even shorter interval. This “oops, it works now!” moment is called the gap phenomenon, and it keeps things exciting in the world of electrophysiology.
Purves, P. D., et al. (2020). Cardiac Electrophysiology: Guide for Nurses, Techs, and Fellows. Cariotext.
7.5. SVTDS -Ventricular Effective Refractory Period (V)
The Tale of S1 and S2
Imagine the heart as a busy dance floor. Each beat (S1) gets the party started, but if the DJ (you) tries to drop another beat too soon (S2), the dancers (myocardium) are still catching their breath and can’t respond. Voilà, you’ve hit the ERP (Effective Refractory Period) of the ventricles!
Here’s what happens:
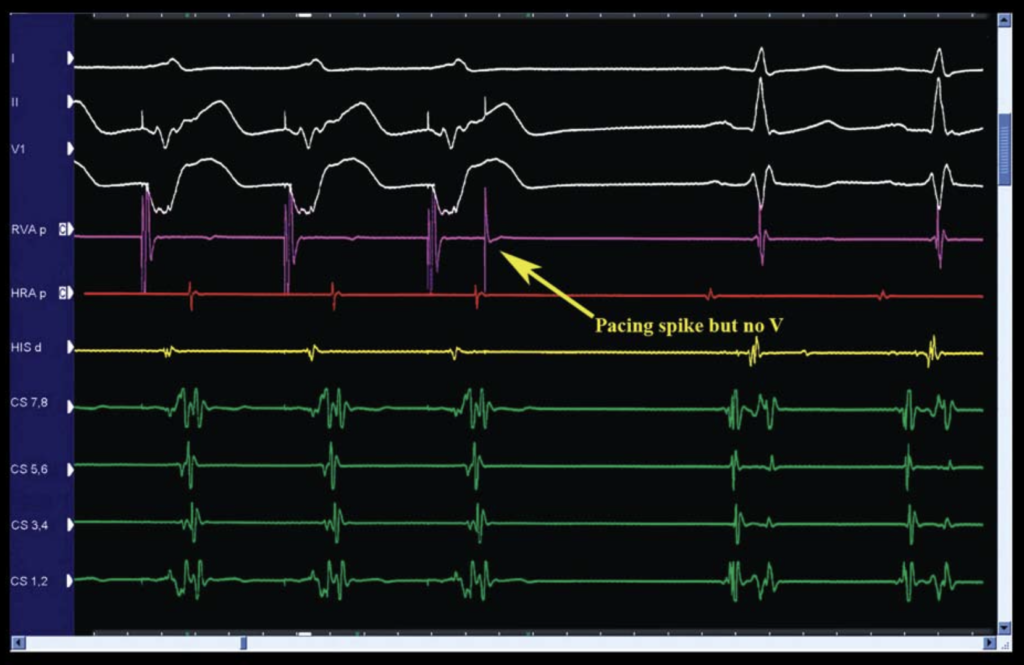
- When S2 shows up too quickly, the heart gives a silent shrug—no response, no QRS spike on the ECG. That’s what we call “no capture” (NC).
- But wait! Sometimes NC isn’t a real ghosting situation—it could just be your pacing catheter losing contact with the heart. To be sure, run the test again at the same intervals to confirm it’s reproducible NC.
Key Stats:
- NC usually occurs when the S2 interval is in the 250-200 ms range.
Troubleshooting Tips:
- If nothing’s happening, check your pacing current! NC might occur because the current isn’t strong enough to nudge the heart.
- Before you start your study, find the pacing threshold—the minimum current needed to get the heart to respond. During the study, pace at 2-3 times this level (e.g., 2 mA, 2 ms pulse width is usually a safe bet).
Bonus Fact:
The CS catheter, which lounges around the A-V ring, is a bit picky. It might need extra current to get either the atrium (closer in) or the ventricle (farther out) to join the fun. Why? It doesn’t always make great contact with the tissue.
Purves, P. D., et al. (2020). Cardiac Electrophysiology: Guide for Nurses, Techs, and Fellows. Cariotext.
7.6. SVTDS - Atrial Extra-stimulus Pacing (A)
Chasing Tachycardia: The Atrial Extra-Stimulus Adventure 🚀
Next up in our SVT detective work: Atrial Extra-Stimulus Pacing (a fancy way of saying “let’s tease the heart into revealing its secrets”). Here’s how it goes:
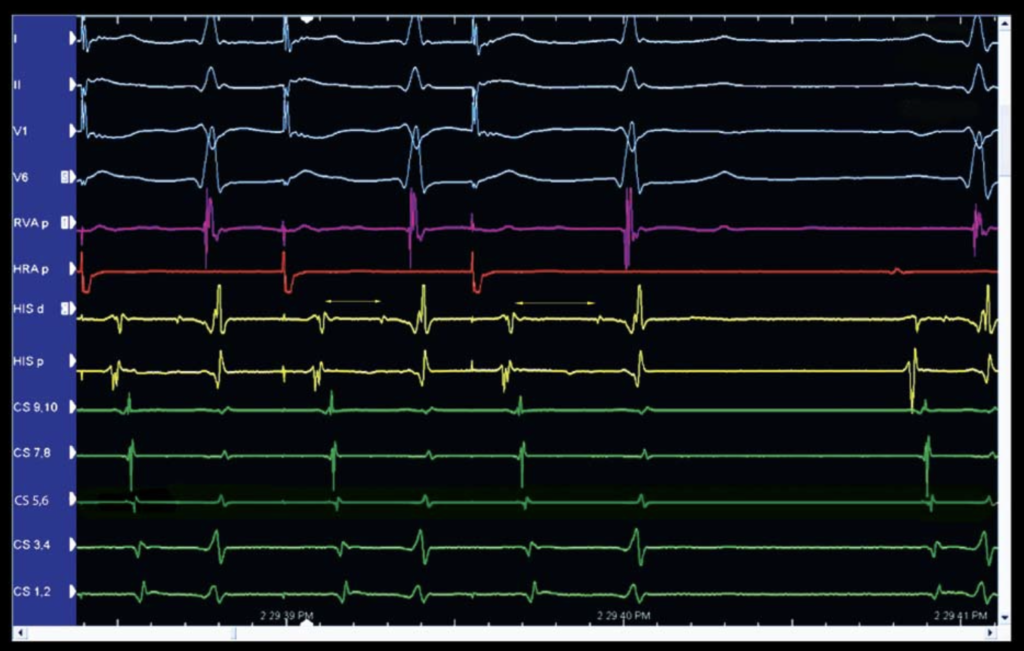
- We send out a steady rhythm of signals (S1), then throw in a wildcard extra beat (S2) to shake things up. This is often the magic trick to uncovering a hidden tachycardia and checking how the A-V system is behaving.
- The star of the show? The A-H interval (marked by yellow arrows). It tells us how long it takes for the signal to travel from the atrium (A) to the His bundle (H).
The AV Node’s Cool Party Trick: Decremental Conduction
- Think of the AV node as a traffic cop. When the cars (S1-S2 intervals) start coming closer together, the cop slows them down more and more to keep things organized. This delay is called decremental conduction.
- On the ECG, this means the A-H interval gets longer as the S1-S2 interval shortens. For example:
- At first, the A-H might be 80-100 ms.
- With shorter S1-S2 intervals, it can stretch to over 200 ms.
Plot Twist: The “Jump” 🚦
- If the A-H interval suddenly gets a lot longer (like +50 ms) when the S1-S2 interval shrinks by just 10 ms, that’s a jump! This usually means the fast pathway is blocked, and the signal is detouring down a slower back road (a “slow pathway”).
- No jump? Don’t worry! It doesn’t mean a slow pathway isn’t there—it might just be sneaky.
Pro Tip: For the real sleuths, plot the A-H interval against the S1-S2 intervals on a graph to spot any subtle curves or jumps. It’s like heart cartography!
Purves, P. D., et al. (2020). Cardiac Electrophysiology: Guide for Nurses, Techs, and Fellows. Cariotext.
7.7. SVTDS - Atrioventricular Block (A)
A-V Block: When the AV Node Says, “Nope!” 🚫⚡
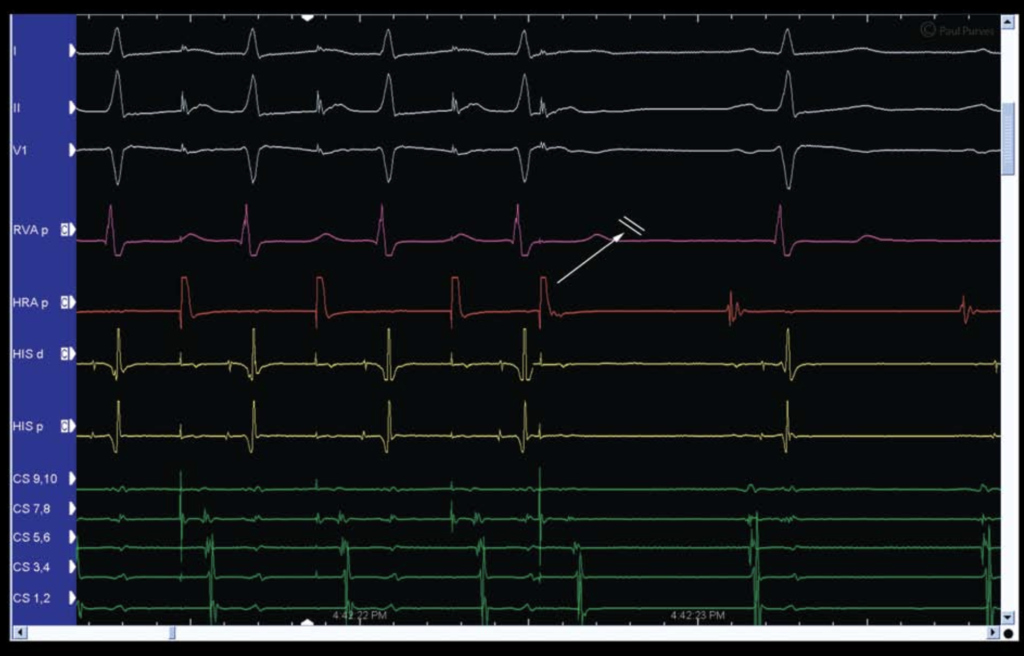
Here’s the deal: as we keep shortening the S1-S2 interval (squeezing those beats closer together), the AV node eventually waves the white flag. This is called the antegrade ERP (Effective Refractory Period) of the AV node. Translation? The AV node gets too tired to pass the signal along to the ventricles.
Here’s what happens on the ECG:
- You’ll see a red pacing spike (S2) followed by a green atrial signal (CS A).
- BUT… no magenta ventricular signal (V), and no QRS on the surface ECG. The ventricles are like, “Not our problem.”
Dual Pathway Drama 🎭
If your patient has dual AV nodal pathways (a fast and a slow one), things get a bit spicier:
- Both the fast and slow pathways can hit their ERPs at different times.
- It’s like a traffic jam on both the highway (fast pathway) and the scenic route (slow pathway).
Plot Twist: The Gap Phenomenon 🤔
But wait! Just when you think the signal is done for, conduction might suddenly come back as you keep shortening the S1-S2 interval. This sneaky behavior is known as the gap phenomenon. It’s like the AV node saying, “Just kidding, I’ll let that one through!”
Purves, P. D., et al. (2020). Cardiac Electrophysiology: Guide for Nurses, Techs, and Fellows. Cariotext.
7.8. SVTDS - Atrial Effective Refractory Period (A)
Atrial ERP: When the Atrium Takes a Timeout ⏸️
Just like its ventricular counterpart, the atrial myocardium has an Effective Refractory Period (ERP)—a point where it just can’t respond to another signal. Here’s how it unfolds:
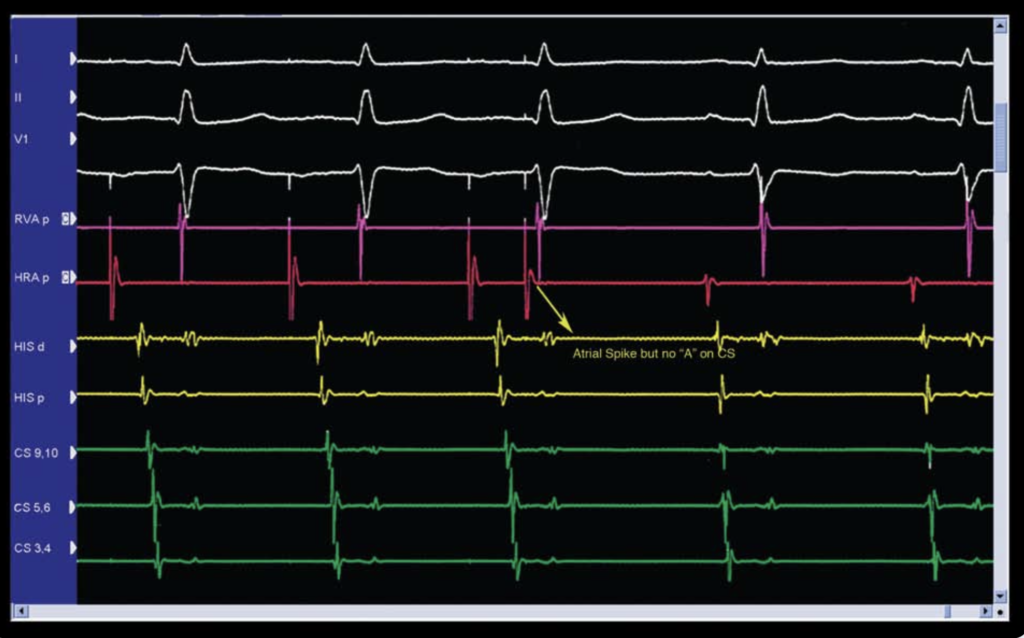
- As we shorten the S1-S2 interval (pushing those signals closer together), each red pacing spike (S1 and S2) is usually followed by:
- A yellow A on the HIS channels.
- A green A on the CS channels.
But then… BAM! The S2 stops generating any “A” signals on either channel. That’s the moment we’ve hit the atrial ERP. 🎯
What Happens Next?
- No “A” signals = No Capture (NC).
- But don’t celebrate NC too soon—it could just be your catheter being lazy and losing contact with the atrium. Always repeat the drive to double-check! 🧐
Pro Tips for Atrial ERP Success 💡
- Good Contact: Keep that catheter snug with the myocardium.
- Sufficient Current: Make sure you’re pacing with enough juice.
- Stability: Nobody likes a wobbly catheter—secure that position!
Purves, P. D., et al. (2020). Cardiac Electrophysiology: Guide for Nurses, Techs, and Fellows. Cariotext.
7.9. SVTDS - Incremental Atrial Pacing (A)
The Final Act: Incremental Atrial Pacing 🎭
It’s time for the grand finale of our diagnostic study: incremental atrial pacing. This maneuver helps us figure out the antegrade block cycle length, or what’s called the antegrade Wenckebach point of the AV node. But be warned—this one’s got drama! It’s the most likely to trigger atrial fibrillation (AF), so proceed with caution. ⚡
What Happens on the ECG?
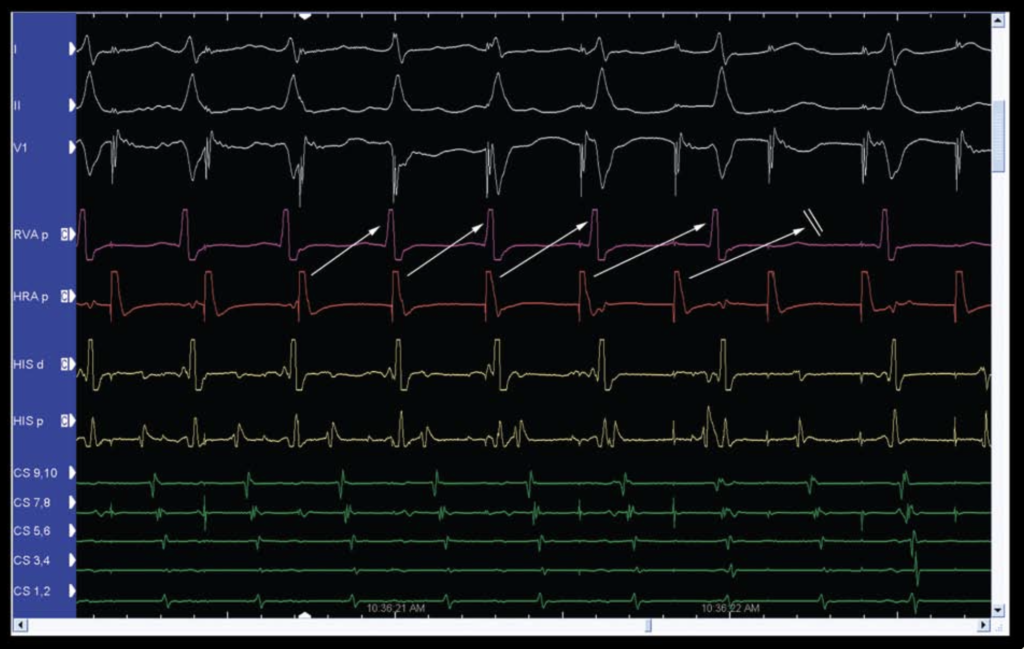
- At first, each red A pacing spike is followed by a magenta VEGM signal in the RVA channel—until something interesting happens:
- At beat number 7, the atrium (A) gives a signal, but the ventricles (V) say, “Nope!” No ventricular response means we’ve hit the antegrade Wenckebach point. 🎯
Decremental Conduction in Action
- The AV node doesn’t just stop suddenly—it slows things down first:
- The A-H interval (time from atrium to His bundle) gets longer and longer with each beat, like a stretching elastic band.
- You can see this in the tracing: the gap between the A pacing spike and the RVA response (represented by progressively longer arrows) keeps growing. Even the A-V distance on the CS channels gets bigger!
Potential Twists & Turns 🚦
Watch out for these plot twists during incremental pacing:
- Tachycardia Induction: Pacing can sometimes trigger a tachycardia—so keep your eyes peeled.
- A-H Jump: If the A-H interval suddenly jumps up, you might have revealed dual AV nodal pathways.
- AF Risk: Going too fast (pacing < 300 ms) can trigger AF. At 250 ms or faster, the risk skyrockets. Don’t linger at these fast pacing rates—AF is waiting to crash the party!
Key Takeaway: Handle incremental atrial pacing with care—it’s a powerful but tricky tool. Nail this maneuver, and you’ve mastered one of the most exciting parts of the diagnostic study! 🕵️♂️⚡
Purves, P. D., et al. (2020). Cardiac Electrophysiology: Guide for Nurses, Techs, and Fellows. Cariotext.